High-density 3D LiDAR mapping at Cleveland Tin Projects, capturing underground workings safely and without human entry.
Executive Summary
Survey contractor: Southern Lidar
Sales partner: Chironix (Australia)
Location: Northwestern Tasmania
Mine depth: > 400 m
Historic production: 5.65 Mt @ 0.68% Sn, 0.28% Cu
Scout flights: 3
Flight time: Almost 1 hour per flight, about 2.5 hours in total
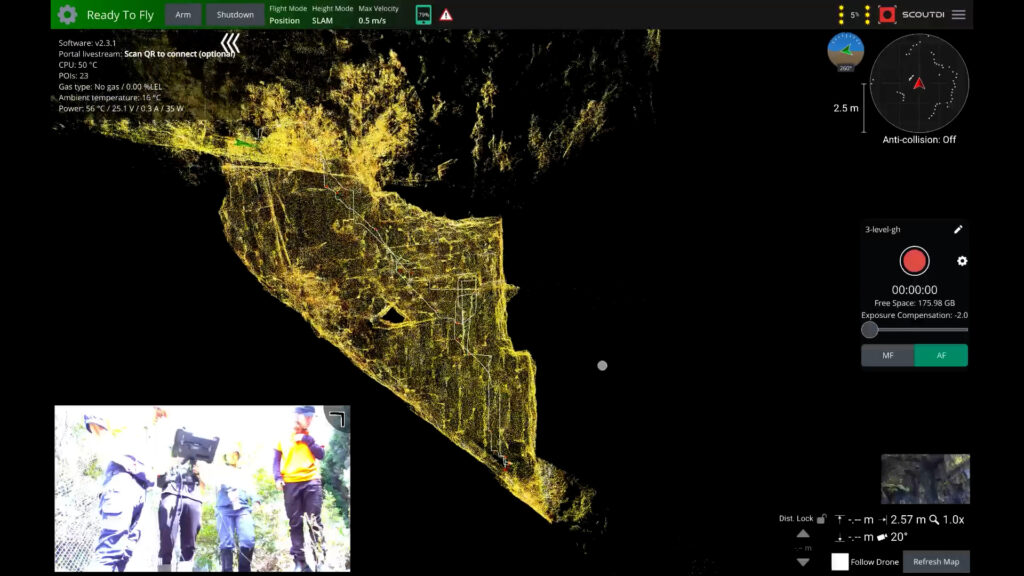
Estimated mapped volume: ~2 million m³
Purpose: Support geological evaluation and potential mine re-opening.
Background and Challenge
The Cleveland Tin Project operated as an underground mine from 1908–1917 and again from 1968–1986. In total, 5.65 million tonnes of ore were mined at 0.68% Tin and 0.28% Copper, producing 23,519 tonnes of Tin and 9,691 tonnes of Copper.
Historical workings extend more than 400 meters below surface. A reopening is currently being considered.
The primary commodities historically extracted were tin and copper. But Tungsten has also been identified within the deposit, adding further strategic relevance to renewed evaluation efforts.
The Challenge
Existing documentation largely consisted of hand-drawn plans from the 1980s. A modern, high-resolution 3D model was required to support geological and economic assessment.
Large parts of the mine are difficult or impossible to access with handheld scanners or conventional drone systems.
The Setup
Southern Lidar was commissioned to generate a new 3D model of the underground workings. Chironix, ScoutDI’s regional sales partner, facilitated the deployment and supported the project locally.
The survey workflow combined:
- Handheld LiDAR scanning
- DJI outdoor drone with LiDAR payload
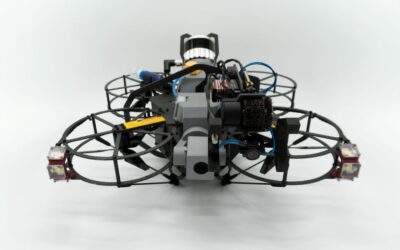
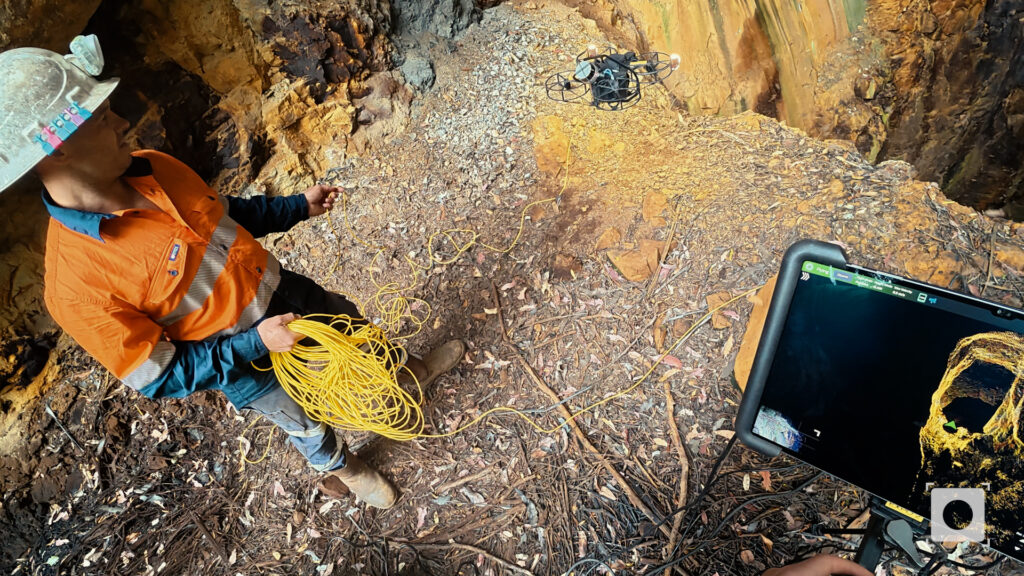
- Scout 137 Gen 3 for deep, inaccessible and higher-risk areas
The Scout system was used where handheld equipment and untethered drones could not safely or practically operate.
The Scout 137 Deployment
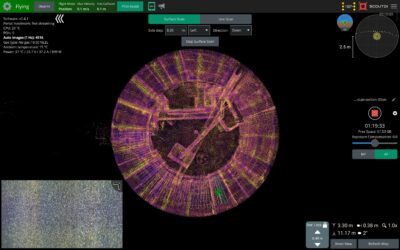
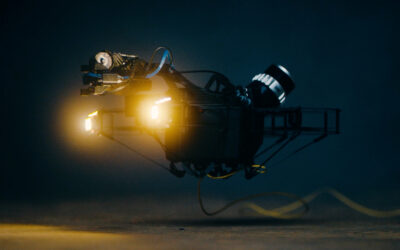
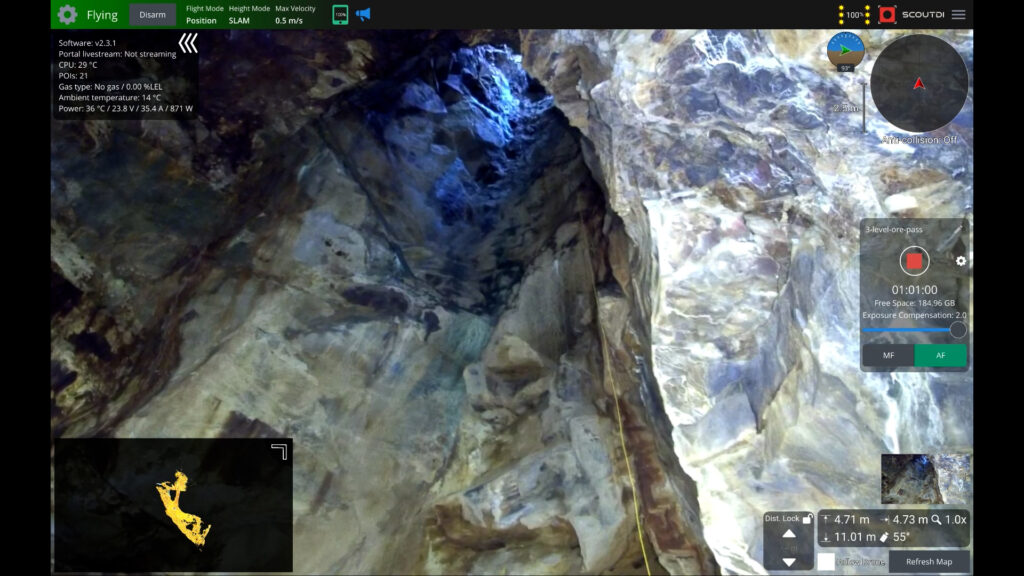
Three flights were conducted, each approximately one hour in duration. Using its 60 m tether and survey-grade 3D LiDAR, Scout 137 Gen 3 enabled stable BVLOS mapping in vertical shafts and extended underground sections.
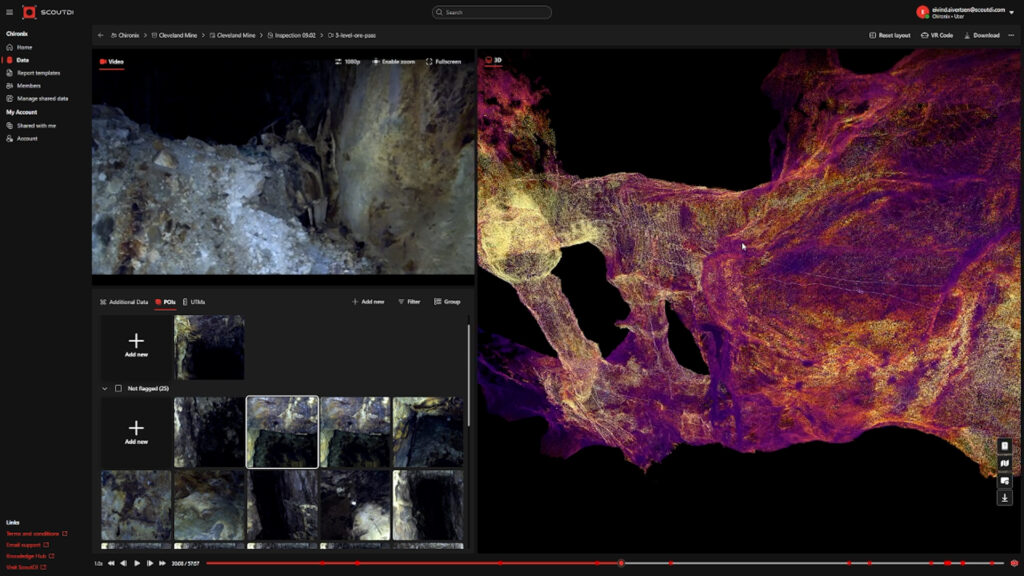
Ground control markers were placed to support georeferencing and alignment between Leica datasets, DJI LiDAR captures, and Scout LiDAR data. All data was exported for post-processing and stitching in CloudCompare. The resulting point clouds represent some of the largest high-resolution underground captures performed with the Scout system to date.
Three flights were conducted, each approximately one hour in duration. Using its 60 m tether and survey-grade 3D LiDAR, Scout 137 Gen 3 enabled stable BVLOS mapping in vertical shafts and extended underground sections.
Ground control markers were placed to support georeferencing and alignment between Leica datasets, DJI LiDAR captures, and Scout LiDAR data.
All data was exported for post-processing and stitching in CloudCompare. The resulting point clouds represent some of the largest high-resolution underground captures performed with the Scout system to date.
Why It Matters
A potential reopening of an underground mine depends on more than historical production figures.
Accurate 3D mapping provides a current spatial understanding of legacy workings. It supports structural assessment, identification of accessible development zones, safe access planning, and integration with new drilling campaigns.
Core drilling programs extract cylindrical rock samples to determine mineral content and grade distribution. These results form the basis for resource modeling and revenue forecasting. However, drill cores represent discrete data points. Their value increases significantly when positioned within an accurate spatial framework.
An updated 3D model enables alignment of drill data with actual underground geometry. Historical workings, new boreholes, and geological interpretation can be evaluated within the same coordinate system.
Visual data adds another layer. High-resolution video and imagery captured during mapping flights allow preliminary visual assessment of vein exposure, fracture systems, oxidation patterns, water ingress and rock surface conditions. While visual inspection does not replace laboratory assays, it supports geological interpretation between boreholes and helps validate drill targeting decisions.
When geometry, drilling data and visual documentation are combined, uncertainty is reduced and feasibility assessments become more robust.